Relevant Infographics About Climate Change
Climate change is a complex and pressing global issue that can be difficult to understand. Infographics can help make the science of climate change more accessible by illustrating how climate change affects people, the environment, and the economy.
When it comes to learning about climate change, sometimes pictures are worth a thousand words. And when it comes to creating your own infographics, turning data into visually appealing graphs and charts can be easy by using online tools like infographic templates.
This way you can communicate the complex information in an understandable way for everyone. By creating your own climate change infographics, you can help to raise awareness about this urgent issue.
Relevant Topics and Infographic Samples on Climate Change
Let’s take a look at some relevant topics and samples about climate change.
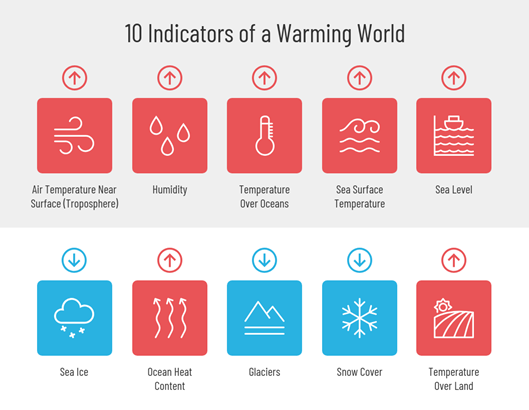
Climate Change in Numbers
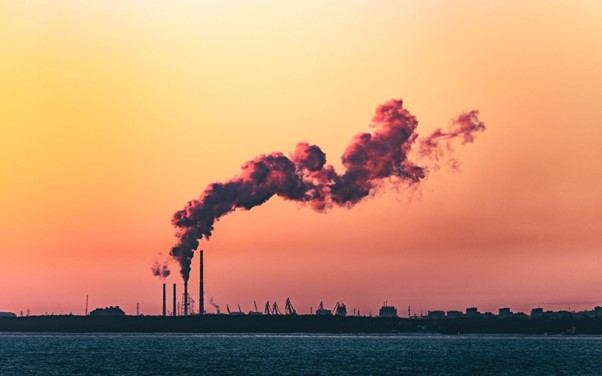
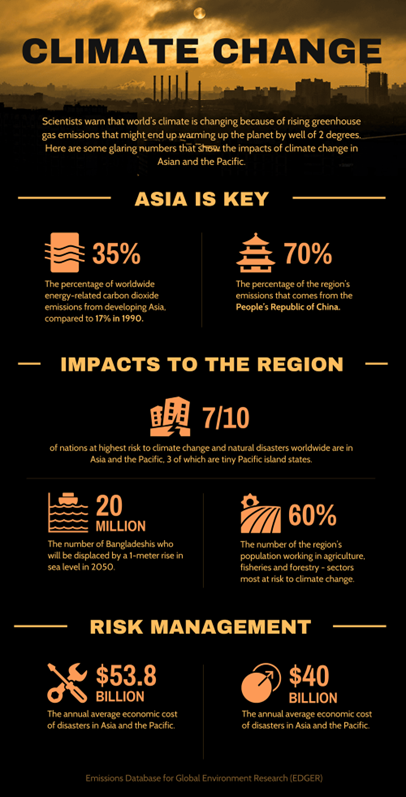
Climate change is one of the most pressing issues facing our planet today. While the causes of climate change are complex and multi-faceted, the effects are undeniable. Rising temperatures, more extreme weather events, and melting polar ice caps are just a few of the ways that climate change is impacting our world.
To better understand the scale of this problem, an infographic with some key statistics about climate change is very useful. From greenhouse gas emissions to rising sea levels, an infographic can very well illustrate some of the most important numbers to know about climate change.
By understanding the scope of the problem, we can all do our part to help mitigate its effects.
Venngage
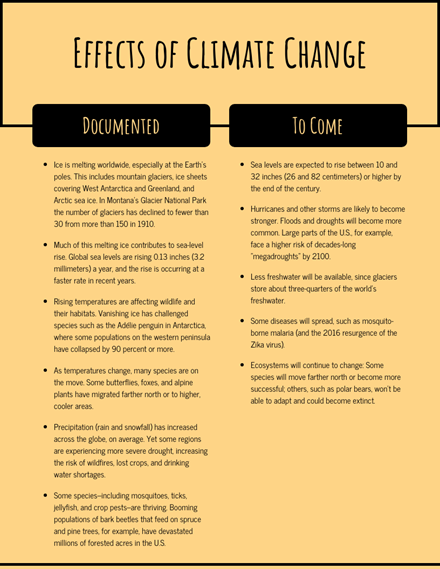
The Impacts of Climate Change
In addition to the staggering statistics, it’s important to understand the human impact of climate change. As the global temperature rises, so does the risk for many types of disasters. From hurricanes to wildfires, extreme weather events are becoming more and more common.
And as the Earth’s climate changes, it also affects our health and well-being. Diseases like malaria and Dengue fever are spreading as the mosquitoes that carry them thrive in warmer climates, while food shortages and water shortages are also becoming more common.
All of these impacts have an enormous cost, both human and financial. It’s estimated that climate change costs the world $1.2 trillion every year. That’s a lot of money! An infographic about the effects of climate change can help to illustrate the seriousness of this issue.
Venngage
Mitigating Climate Change
So what can we do about climate change? There are many things that each of us can do to help reduce our carbon footprint and slow down the warming of our planet. From reducing energy consumption to driving less, there are many small changes we can make that will add up.
An infographic about ways to mitigate climate change is a great way to show people just how easy it is to make a difference. And with so many different ways to reduce emissions, there’s something for everyone!
The Paris Agreement
In 2015, world leaders came together in Paris to sign the historic Paris Agreement, pledging to take action on climate change. This agreement is a global commitment to fighting climate change and it sets out a plan to keep the global temperature from rising more than 2°C.
An infographic about the Paris Agreement is a great way to show how the world is working together to address climate change. It also illustrates some of the ways that individuals can reduce their carbon footprint.
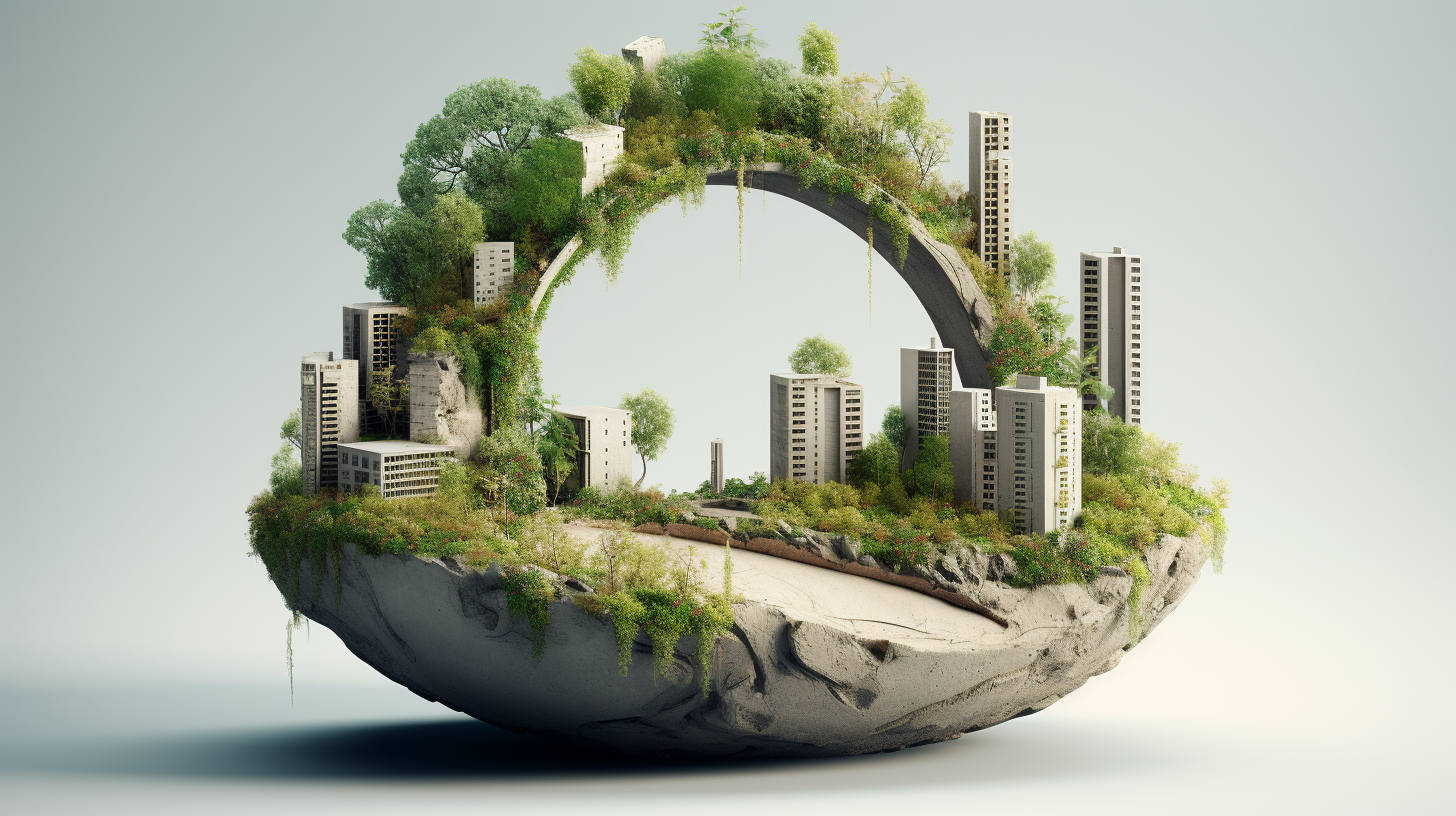
The Future of Climate Change
While we are making progress in mitigating climate change, there is still much work to be done. And as climate change progresses, it’s important to understand the potential impacts on our planet. An infographic about the future of climate change can help to shed light on some of the possible scenarios that could occur if we don’t take action.
From sea level rise to extinctions, an infographic about the future of climate change can help to paint a worrying picture of what could happen if we don’t take steps to address this problem.
Venngage
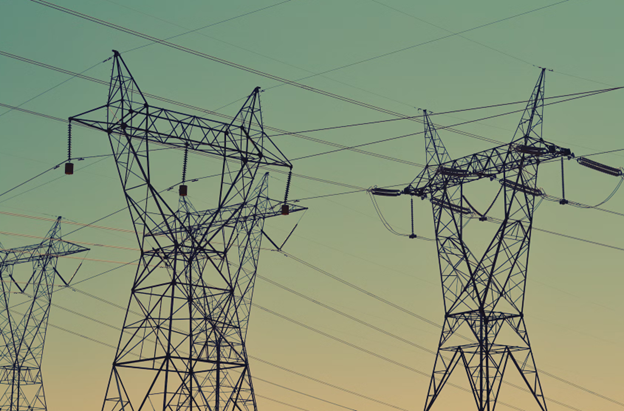
Greenhouse Gases and Global Warming
One of the main causes of climate change is the emission of greenhouse gases into the atmosphere. These gases, like carbon dioxide and methane, trap heat and cause the Earth to warm.
An infographic about greenhouse gases is a great way to understand this complex issue. It can help to explain where these gases come from, how they contribute to global warming, and what we can do to reduce them.
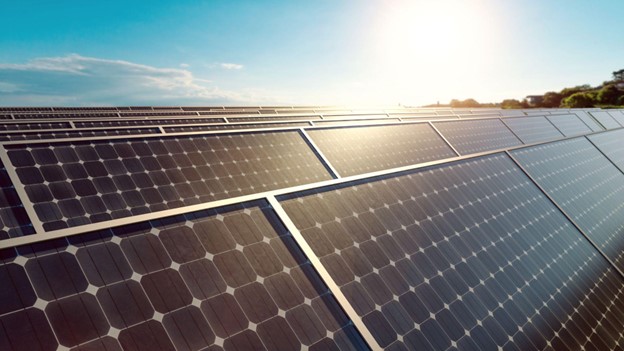
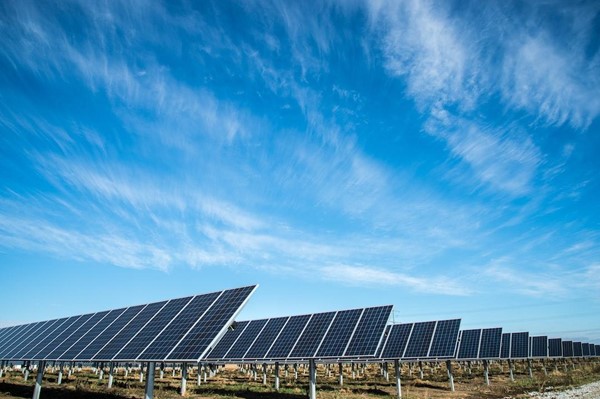
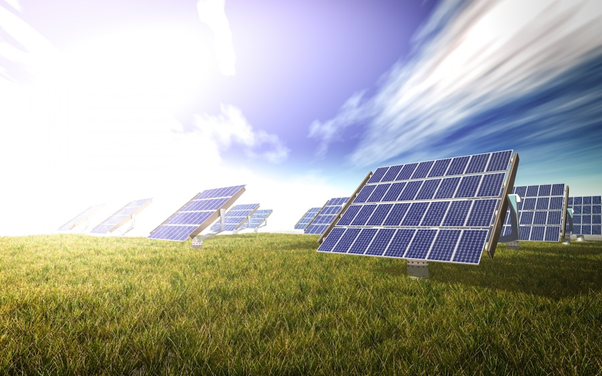
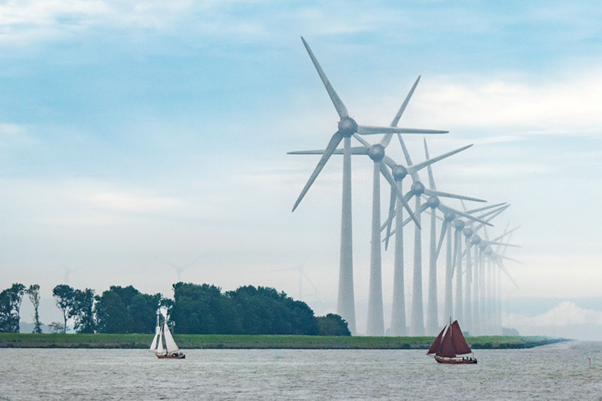
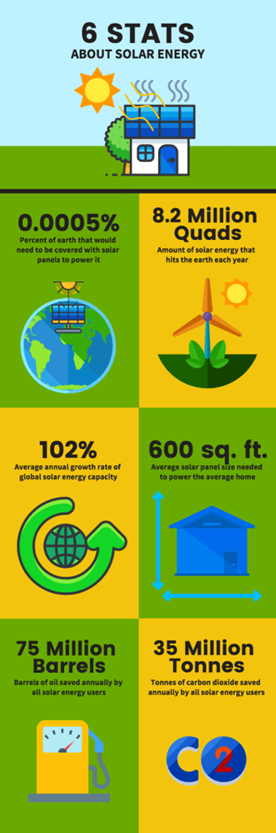
Renewable Energy
As we work to address climate change, it’s important to look for ways to reduce our dependence on fossil fuels. One way to do this is by increasing our use of renewable energy sources like solar and wind power.
An infographic about renewable energy is a great way to show how this energy works and why it’s an important part of the solution to climate change. It can also highlight some of the benefits of renewable energy, like how it reduces emissions and helps to protect the environment.
Venngage
The bottom line is that climate change is a real and serious problem, and we need to take action now to address it. An infographic is a great way to communicate this complex issue in a clear and concise way.
Venngage is an excellent free infographic maker that has plenty of infographic templates for creating professional-looking infographics.
With tons of templates to choose from and the ability to easily add charts, graphs, and images, you can create a high-quality infographic in no time. And if you’re not sure where to start or need some help getting started, their extensive library of tutorials will walk you through every step of the process.
So what are you waiting for? Start creating beautiful infographics today!